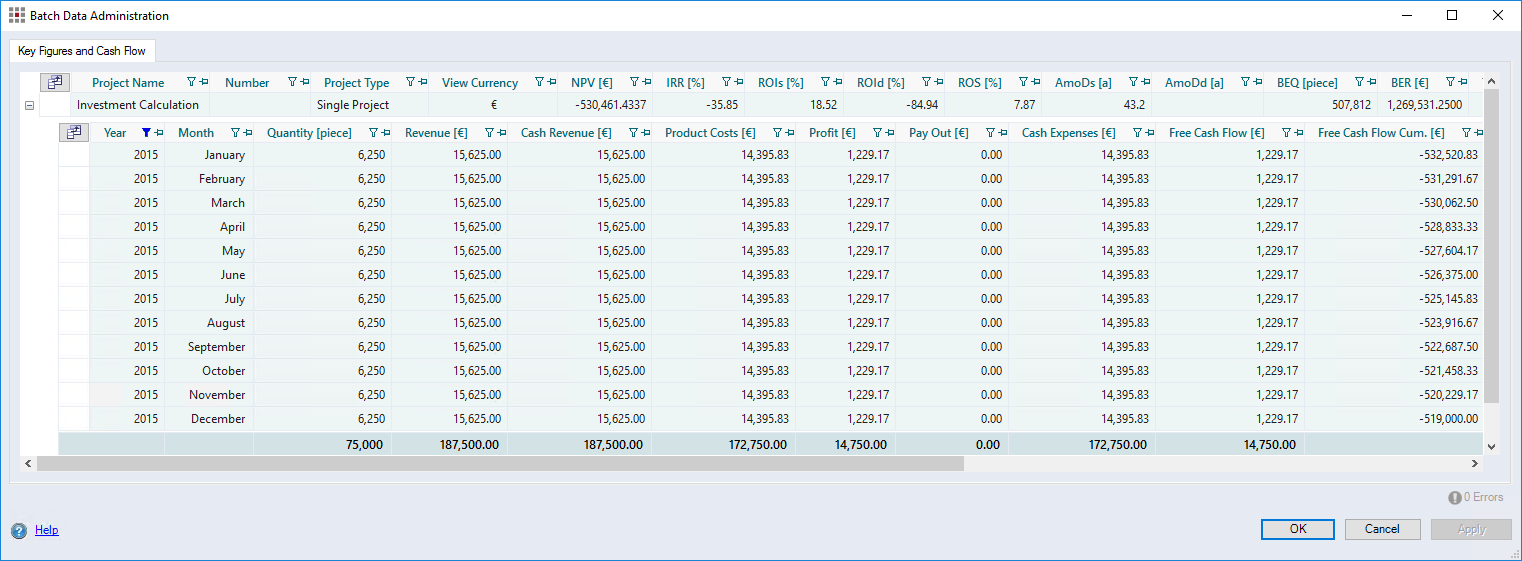
"Key Figures and Cash Flow" category
Here you can see various key figures of all opened projects in order to detect changes in other categories (e.g. investment changes) as efficiently as possible.
-
"Column Chooser" button

Click this button to open the "Column Chooser" dialog.
You can show or hide individual columns with additional values, provided that you have read permission on the values. The Column Chooser settings are user-specifically saved. The attributes are hidden by default; they can be displayed but not edited.
| Column | Description |
|---|---|
| Project Name | Shows the name of the project. |
| Number | Displays the number of the project. |
| Project Type |
Shows the project type.
|
| View Currency | Shows the view currency of the multi project. Project key figures and cash flow are displayed in this view currency. |
| NPV [EUR] |
Shows the net present value. = The difference between the present value of cash inflows and outflows over time. |
| IRR [%] |
Shows the internal rate of return. = The discount rate that makes the net present value of all cash flows equal to zero. |
| ROIs [%] |
Shows the static return on investment. = The return on investment calculated without considering the time value of money. |
| ROId [%] |
Shows the dynamic return on investment. = The return on investment considering the time value of money. |
| ROS [%] |
Shows the return on sales. = The percentage of revenue remaining after all costs have been deducted. |
| AmoDs [a] |
Shows the static amortization time in years. = The time it takes for an investment to be recovered from profits without considering interest. |
| AmoDd [a] |
Shows the dynamic amortization time in years. = The time it takes for an investment to be recovered from profits, considering interest. |
| BEQ [St] |
Shows the break-even quantity. = The number of units that must be sold to cover all costs. |
| BER [EUR] |
Shows the break-even revenue. = The revenue needed to cover all costs. |
| TQ [St] |
Shows the total quantity. = The total number of units produced or sold. |
| R [EUR] |
Shows the revenue. = Total income generated from sales before any costs are deducted. |
| PC [EUR] |
Shows the production costs. = The total cost of producing the products sold. |
| P [EUR] |
Shows the profit. = The financial gain, calculated as revenue minus product costs. |
| INV [EUR] |
Shows the investments. = The amount of money invested in the project or production. |
| IR [%] |
Shows the annual interest rate of the calculation. = The percentage charged on borrowed money. |
| TPI [EUR] |
Shows the total pay in. = The total amount of money paid into the project. |
| TPO [EUR] |
Shows the total pay out. = The total amount of money paid out in expenses. |
Table of costs (level 2)
| Column | Description |
|---|---|
| Year | Shows the calculation year. |
| Month | Shows the month of the calculation year. |
| Quantity [piece] | Shows the project quantity. |
| Revenue [EUR] | Shows the revenue over project lifetime. |
| Cash Revenue [EUR] | Shows the annual cash revenues as a sum of the revenue and direct payments. |
| Product Cost [EUR] | Shows the annual project and product cost. |
| Profit [EUR] | Shows the annual profit. |
| Pay Out [EUR] | Shows the annual pay outs. |
| Cash Expenses [EUR] | Shows the annual cash expenses as a sum of the product costs and pay outs. |
| Free Cash Flow [EUR] | Shows the free cash flow. |
| Free Cash Flow Cum. [EUR] | Shows the cumulated free cash flow. |
| Free Cash Flow Disc. [EUR] | Shows the discounted free cash flow. |
- Investment Calculation
- "Project Cockpit" > "Investment" Category